Proteomics Services: What They Measure, What They Cost, and Which One to Buy
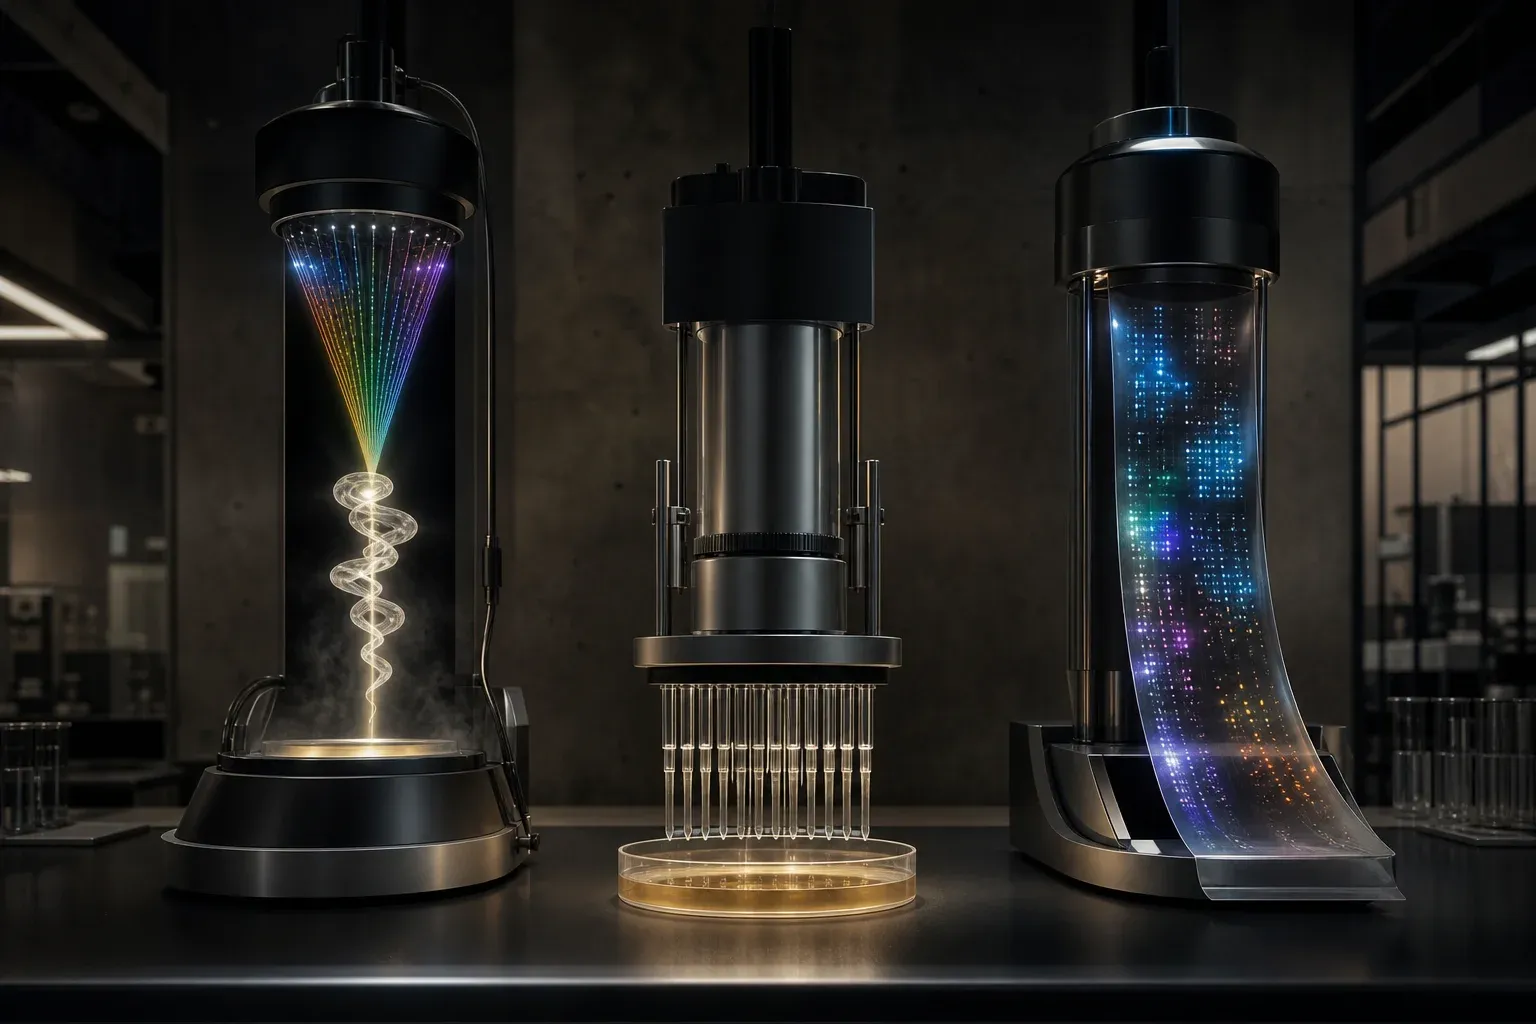
A proteomics service measures which proteins are present in a sample and in what relative amounts. Three distinct technologies are sold under that one label: liquid chromatography–tandem mass spectrometry (LC-MS/MS), antibody-based proximity extension assays (Olink), and aptamer arrays (SomaScan). They are not interchangeable. Mass spectrometry identifies proteins without prior knowledge of what you are looking for but struggles with the enormous concentration range of blood plasma. Affinity platforms measure a fixed pre-selected list of a few thousand proteins with far better sensitivity for low-abundance analytes. They can only find what is on the list, and they report signal rather than absolute concentration. For an individual profiling their own plasma longitudinally, we would buy an affinity panel first and add mass spectrometry only for a specific hypothesis.
What a proteomics service delivers
The commercial providers that rank for this query are mostly selling contract work to labs and pharmaceutical groups. They include Cell Signaling Technology, Charles River, Creative Proteomics, and university cores such as Michigan and the Vermont Biomedical Research Network. The work is target identification, post-translational modification mapping and host cell protein analysis for biologics. That market is oriented around a project, not a person, and the deliverable is usually a report plus a spreadsheet 1. If you are profiling yourself, you want the opposite arrangement: a standardized assay run on your plasma, with the instrument-level files and the normalization metadata handed over so you can reprocess later when a better search engine or a better panel arrives.
Ask four things before you pay. What raw file format do I receive? What normalization was applied and can it be reversed? Will my sample be run on the same plate or batch as other samples I submit in the future, and how much plasma is consumed per assay? The answers separate a service you can build on from one that hands you a PDF.
The three platform families
Mass spectrometry is the general-purpose option. A modern data-independent acquisition (DIA) run on a Thermo Orbitrap Astral or Bruker timsTOF will quantify on the order of 400 to 700 plasma proteins from neat plasma in a 30-minute gradient, and a few thousand if the top 14 abundant proteins are depleted or the sample is fractionated. The constraint is physics: albumin is roughly ten orders of magnitude more concentrated than interleukins, and no amount of instrument time gets a peptide detected when the ion current is dominated by the same few carrier proteins. Depletion recovers depth but adds variance, because the depletion column removes bound cargo along with albumin. Expect the raw data as Thermo .raw or Bruker .d directories.
Proximity extension assay panels (Olink Explore HT, roughly 5,400 protein assays) use paired antibodies carrying DNA oligos. Proximity binding creates a template that is amplified and read out by next-generation sequencing. Because detection is a sequencing count rather than a mass spectrum, sensitivity reaches into the picogram-per-milliliter range, and sample consumption is small. The output is NPX, Normalized Protein eXpression, an arbitrary log2 unit. NPX is comparable across samples within a study but is not a concentration, so a value of 4.2 for IL-6 tells you nothing absolute and everything relative.
Aptamer arrays (SomaScan 7k and 11k) use modified DNA aptamers called SOMAmers, read out on a hybridization array, and report relative fluorescence units. Coverage is the broadest available on a single assay. The known weakness is specificity: an aptamer binds a conformation, and cross-reactivity or a coding variant that alters the epitope can produce a signal that tracks something other than the protein named on the label. Both affinity platforms depend on the reagent binding what the catalog says, which is why cross-platform correlation between Olink and SomaScan is high for some proteins and near zero for others.
What it costs
University cores publish their rates, and they are the cheapest reliable benchmark. A single LC-MS/MS run with in-gel or in-solution digestion typically lands between $100 and $400 per sample. Sample preparation, depletion, and fractionation are billed separately and often double that. Commercial contract providers quote per project and are usually several times higher, because the price includes method development and a written report.
Affinity panels are priced per sample and per panel. A full Olink Explore HT or SomaScan 11k run on one plasma sample is commonly quoted in the $750 to $1,500 range through a service provider. Smaller focused panels for inflammation, cardiometabolic, and neurology cost a few hundred dollars. Batch pricing matters: most providers require a minimum sample count, so a single individual usually goes through a reseller or a core that pools orders. Budget for at least two timepoints, because a single proteomic snapshot has no reference against which to interpret a deviation.
The data to insist on, and how to process it
For mass spectrometry, take the vendor raw files. The report alone is not enough. Convert with ProteoWizard msconvert --mzML --64 --zlib --filter "peakPicking vendor msLevel=1-2". Then search DIA data with DIA-NN in library-free mode against a UniProt human FASTA with --fasta-search --met-excision --cut K*,R* --missed-cleavages 1 --qvalue 0.01, or use FragPipe with MSFragger for data-dependent runs. Both apply a 1% false discovery rate at peptide and protein level via target-decoy competition, and both emit a protein-level matrix with MaxLFQ intensities. Verify the decoy rate and the number of proteins quantified in at least 70% of runs before you interpret anything.
For Olink, the deliverable is a long-format CSV or parquet with one row per sample-assay pair. It also includes QC warnings derived from incubation, extension, and detection controls. Load it with the OlinkAnalyze R package, check olink_qc_plot(), and drop assays below the limit of detection in most of your samples rather than imputing them. For SomaScan, the deliverable is an .adat file, read with SomaDataIO::read_adat(). You should know whether ANML (adaptive normalization by maximum likelihood) was applied, since it pulls your sample toward a reference population and can mask a real global shift.
Missing values are structurally different across platforms. In mass spectrometry, missingness is largely not-at-random: the protein was below the detection threshold in that run. Filtering to proteins present in most runs is safer than imputing, and if you must impute, use a left-censored method such as QRILC rather than mean substitution. On affinity platforms, values below the limit of detection are still reported as numbers, which means noise arrives disguised as data.
Batch effects are the dominant nuisance in longitudinal self-measurement. If your second draw is run on a different plate months later, the plate shift will be larger than most biological changes you care about. The fix is bridging: freeze aliquots of an earlier sample and have them re-run alongside new ones, then normalize with the bridge samples before comparing timepoints. Where you have true technical replicates, methods that model replicate variance explicitly rather than averaging it away give better-calibrated differential results 2.
Once you have a clean matrix, enrichment analysis over pathways or GO terms is the usual next step, and web services such as GeneTrail2 accept protein-level scores alongside transcript data if you want to test whether a set moves coherently 3. Self-service exploration platforms like Omics Playground handle clustering, differential testing, and signature comparison without writing code 4. For context on what a given protein’s abundance looks like across tissues and cell lines, ProteomicsDB aggregates large quantitative datasets and is a reasonable sanity check on whether a measurement is plausible 5. Public repositories indexed through the Omics Discovery Index let you find comparable datasets to benchmark against 6.
One boundary is firm. Nearly every proteomics service sold to individuals is research-use-only, and the assays have not been validated as diagnostic tests. A protein that sits outside a reference range in an NPX table is a measurement. It is not a finding about your health. Clinical proteomics remains an area where translation from signal to patient decision is genuinely difficult 7, and interpretation that affects your care belongs with a physician who can order validated clinical assays.
Questions people also ask
What are the top companies in the proteomics industry? On the platform side, Thermo Fisher and Bruker make the mass spectrometers. Olink (now part of Thermo Fisher) and SomaLogic (Standard BioTools) supply the affinity panels, and Alamar and Quanterix sell ultrasensitive immunoassays. On the service side, Charles River, Creative Proteomics, Cell Signaling Technology, and academic cores run samples as contract work. The platform vendor and the service provider are usually different companies, and the platform choice matters more than the provider.
Which company specializes in proteomics? Olink and SomaLogic are the two companies whose business is entirely plasma proteomic panels, and they are the ones to evaluate first for human blood profiling. For discovery mass spectrometry, the specialists are the core facilities and contract labs that run the instruments daily, since method quality varies more than instrument model.
How much does it cost to get a proteomics service? A single mass spectrometry run at a university core is typically $100 to $400 including basic preparation, while a broad affinity panel on one plasma sample generally runs $750 to $1,500. Multi-omic study design costs more than the assay itself once you account for repeat timepoints and bridging samples, which is the part most first-time buyers underestimate 8.
Can I analyze the data myself? Yes, if you are comfortable in R or Python. Mass spectrometry raw files go through DIA-NN or FragPipe, Olink data through OlinkAnalyze, and SomaScan through SomaDataIO. Everything downstream is a matrix with rows as proteins and columns as samples. The hard part is not the code, it is deciding what is a real change and what is plate-to-plate drift.
Footnotes
-
Jennie R. Lill, William R. Mathews, Christopher M. Rose, et al. Proteomics in the pharmaceutical and biotechnology industry: a look to the next decade. Expert Review of Proteomics, 2021. https://doi.org/10.1080/14789450.2021.1962300 ↩
-
Enrico Glaab, Reinhard Schneider. RepExplore: addressing technical replicate variance in proteomics and metabolomics data analysis. Bioinformatics, 2015. https://doi.org/10.1093/bioinformatics/btv127 ↩
-
Daniel Stöckel, Tim Kehl, Patrick Trampert, et al. Multi-omics enrichment analysis using the GeneTrail2 web service. Bioinformatics, 2016. https://doi.org/10.1093/bioinformatics/btv770 ↩
-
Murodzhon Akhmedov, Axel Martinelli, Roger Geiger, et al. Omics Playground: a comprehensive self-service platform for visualization, analytics and exploration of Big Omics Data. NAR Genomics and Bioinformatics, 2019. https://doi.org/10.1093/nargab/lqz019 ↩
-
Patroklos Samaras, Tobias Schmidt, Martin Frejno, et al. ProteomicsDB: a multi-omics and multi-organism resource for life science research. Nucleic Acids Research, 2019. https://doi.org/10.1093/nar/gkz974 ↩
-
Yasset Perez-Riverol, Mingze Bai, Felipe da Veiga Leprevost, et al. Discovering and linking public omics data sets using the Omics Discovery Index. Nature Biotechnology, 2017. https://doi.org/10.1038/nbt.3790 ↩
-
Elena López, Luis Madero, Juan López-Pascual, et al. Clinical proteomics and OMICS clues useful in translational medicine research. Proteome Science, 2012. https://doi.org/10.1186/1477-5956-10-35 ↩
-
Xiaofeng Dai, Li Shen. Advances and Trends in Omics Technology Development. Frontiers in Medicine, 2022. https://doi.org/10.3389/fmed.2022.911861 ↩
Woolf Software builds longitudinal molecular profiles of individuals: whole-genome sequencing, blood RNA sequencing, and plasma proteomics, delivered as a detailed report plus every data file. Build your profile.